Planning for Volatile Markets
- Michael Roberts FPFS

- Apr 3, 2020
- 4 min read
I wrote in my recent article that "Successful long-term investors are continuously acting on a Plan, rather than continually reacting to current events". We can't remove the possibility of market volatility from investors' portfolios, so I thought it would be worth taking a more detailed look at how we plan for these eventualities.
To begin with, it's worth remembering that bear markets; defined as a fall of 20% from a previous high, are not uncommon. By my count, this is the eight such bear-market since the end of World War 2. Looking at the previous 7, the average depth was -40%. Currently, the FTSE All Share is down 30% as I write. Of course we don't know how long the current bear market will last, or whether it will get worse before it gets better. However we are certainly still well within the parameters of what I would describe as "normal". The chart below shows this visually.

It’s important to acknowledge that trying to guess when markets will fall is nigh-on impossible; certainly with any accuracy or confidence. Likewise, trying to guess when the markets have reached the top or the bottom is just that; a guess. Only hindsight will tell us with any certainty. That’s why we believe that trying to come out and go back into markets (so-called market timing) is a fools errand. Successful investors stay invested, through good times and bad.
So, given bear markets are not unusual, and we can’t predict them, how do we plan for them? We believe it’s important to set aside sufficient cash to cater for both known and unforeseen eventualities; an emergency fund. There is no simple way to define how much cash you should have, and the appropriate amount for one person might be quite different to another. Thinking about any known expenditure you have coming up, and trying to identify what other costs could occur and how much cash they would require is a good starting point. The objective here is to be able to meet your planned and unplanned expenditure without being forced to sell investments at a low point. So, replenishing your cash reserves should ideally be done when markets are relatively buoyant, rather than during a bear market. Of course, at times this may be unavoidable, as even with the greatest thought and planning, we never know what life has in store for us.
When we create Financial Plans we stress-test them to ensure they remain robust against a range of possible outcomes; death or serious illness for example, but also an unexpected fall in the value of the investments being used to fund the Financial Plan. In the example chart below, we have road-tested the impact of a sudden fall in the value of invested monies.
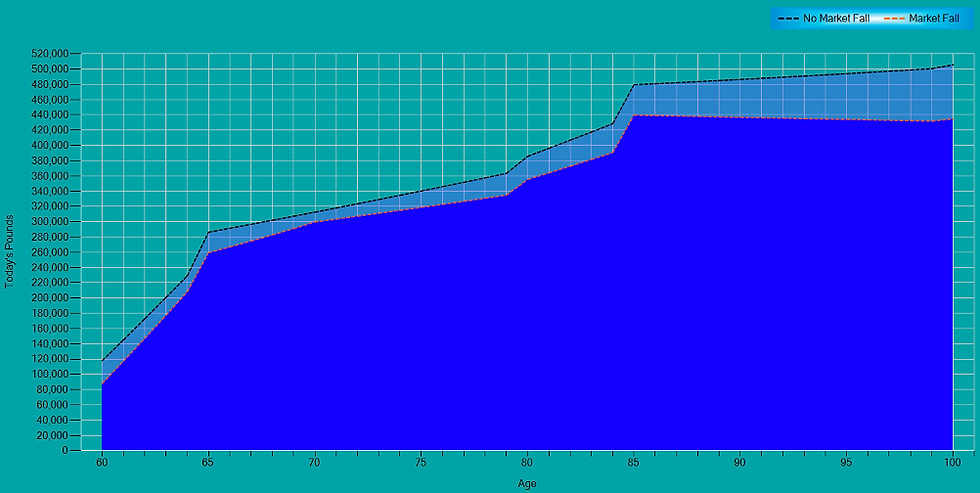
This chart shows the impact on our fictitious client’s long term bucket of an immediate fall in the value of their invested assets of 30%, with a 10 year recovery period. Clearly this does have an impact but at no point does it cause financial difficulty. This individual has the peace of mind that they can withstand a really quite severe and prolonged market fall. As long as they have the faith that things will recover, the patience to wait for this to happen, and the discipline to stick to their Financial Plan, our analysis suggests they’d be ok.
It is important to be mindful of the impact of something known as “Sequence of Return” risk. In short, this refers to the risk that markets may perform very poorly in the early years of drawing income from a portfolio. Continuing to draw income in such circumstances can make it very difficult for the portfolio ever to recover. Again, there’s no way of knowing how markets will perform going forward, but we can check how a planned level of income from any given portfolio would have fared in the past. To do this, we use empirical data going back almost 100 years.
For example, the chart below shows for a particular portfolio the level of income that would have been sustainable over a given period of retirement, based on how underlying markets performed in the past. This allows us to determine whether the chosen level of income would have been sustainable. You can see the level of sustainable income varies quite substantially, depending on the start point and how markets performed thereafter. Each bar represents the maximum level of sustainable income over the retirement period for each starting point. In this example, 1926 gave the best outcome, and 1915 the worst.
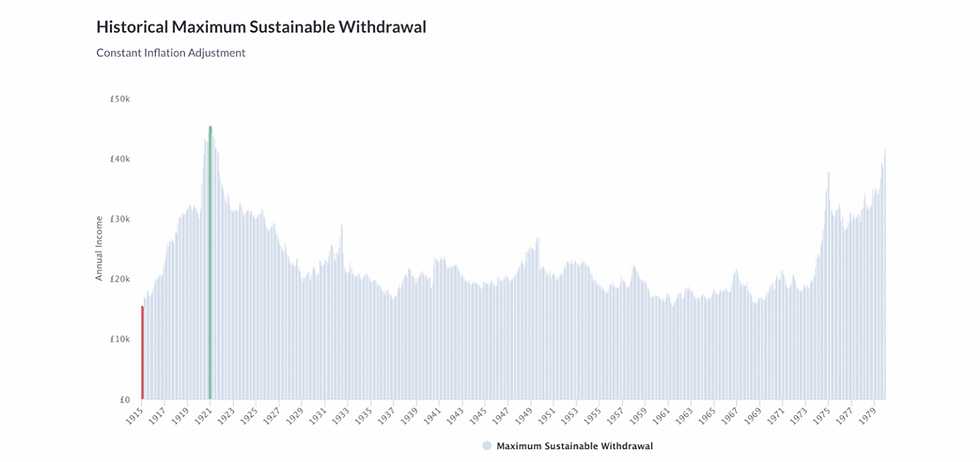
Whilst this isn’t a crystal ball and can’t predict future success (nothing can), it certainly is helpful to know that a planned level of income would have been sustainable in, for example, 90% of historical scenarios going back almost to the beginning of the last century. Regularly monitoring and updating this analysis helps us to ensure a Plan stays on track, and gives the opportunity to make adjustments along the way if necessary.
These technical analyses allow us an excellent starting point that we use in conjunction with other data, coupled with individual views, objectives and personal preferences to prepare for difficult times in the markets.
There's no escaping market volatility, but with a robust approach it gives us the confidence to ride through volatile times in markets that we know, sooner or later, will come along.

Chartered Financial Planner and Director
Like what you read? Click here to have our articles sent straight to your inbox in future.
Please refer to our Legal Declarations page. Nothing in this article should be taken as advice or a personal recommendation.


